Boxplot for a matrix
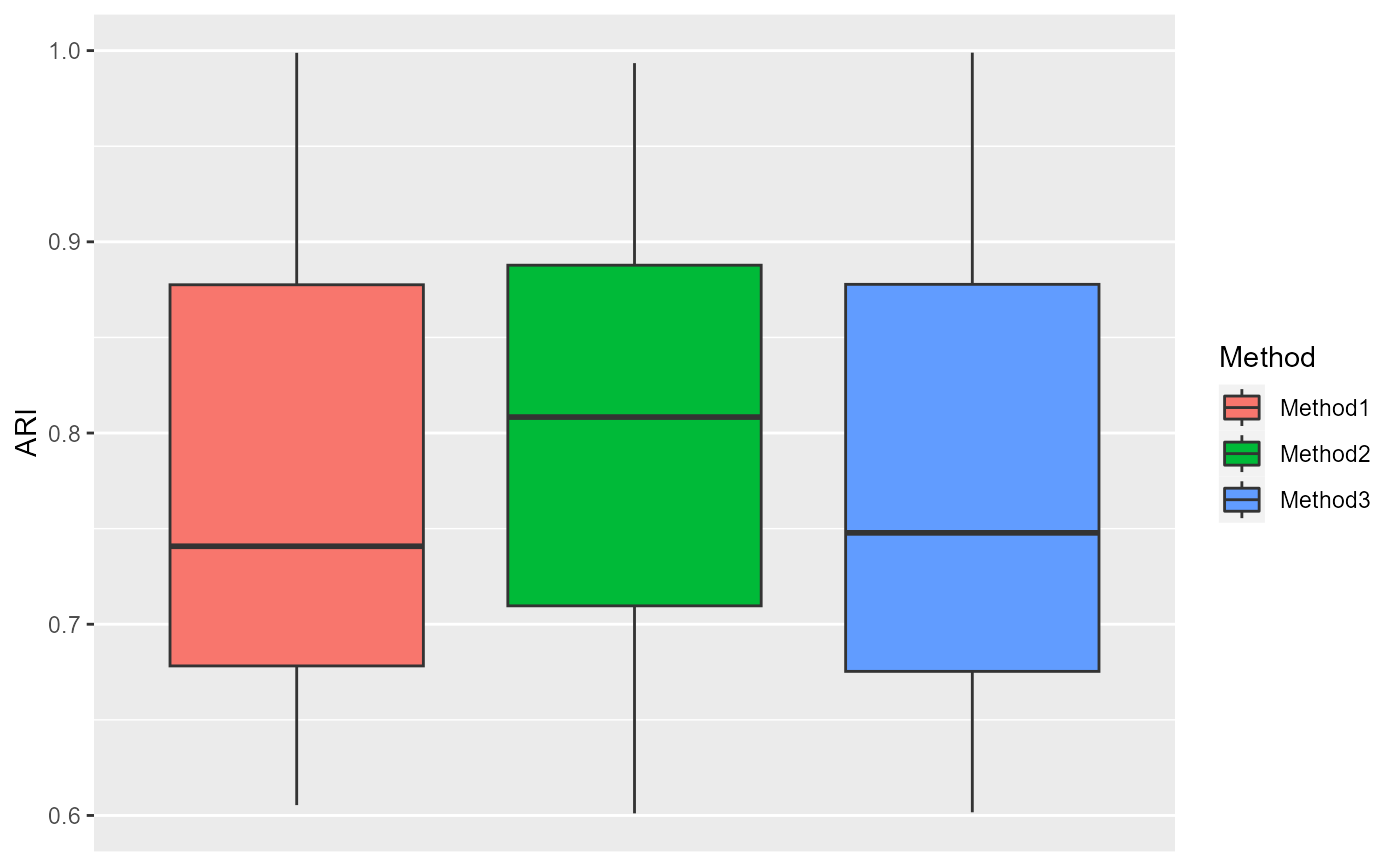
boxPlot.RdBoxplot for a matrix.
boxPlot(mat, ylabel='ARI', cols=NULL, ...)Arguments
Details
Nothing
Value
Return a ggplot2 object.
Note
nothing
See also
None
boxPlot.RdBoxplot for a matrix.
boxPlot(mat, ylabel='ARI', cols=NULL, ...)Nothing
Return a ggplot2 object.
nothing
None