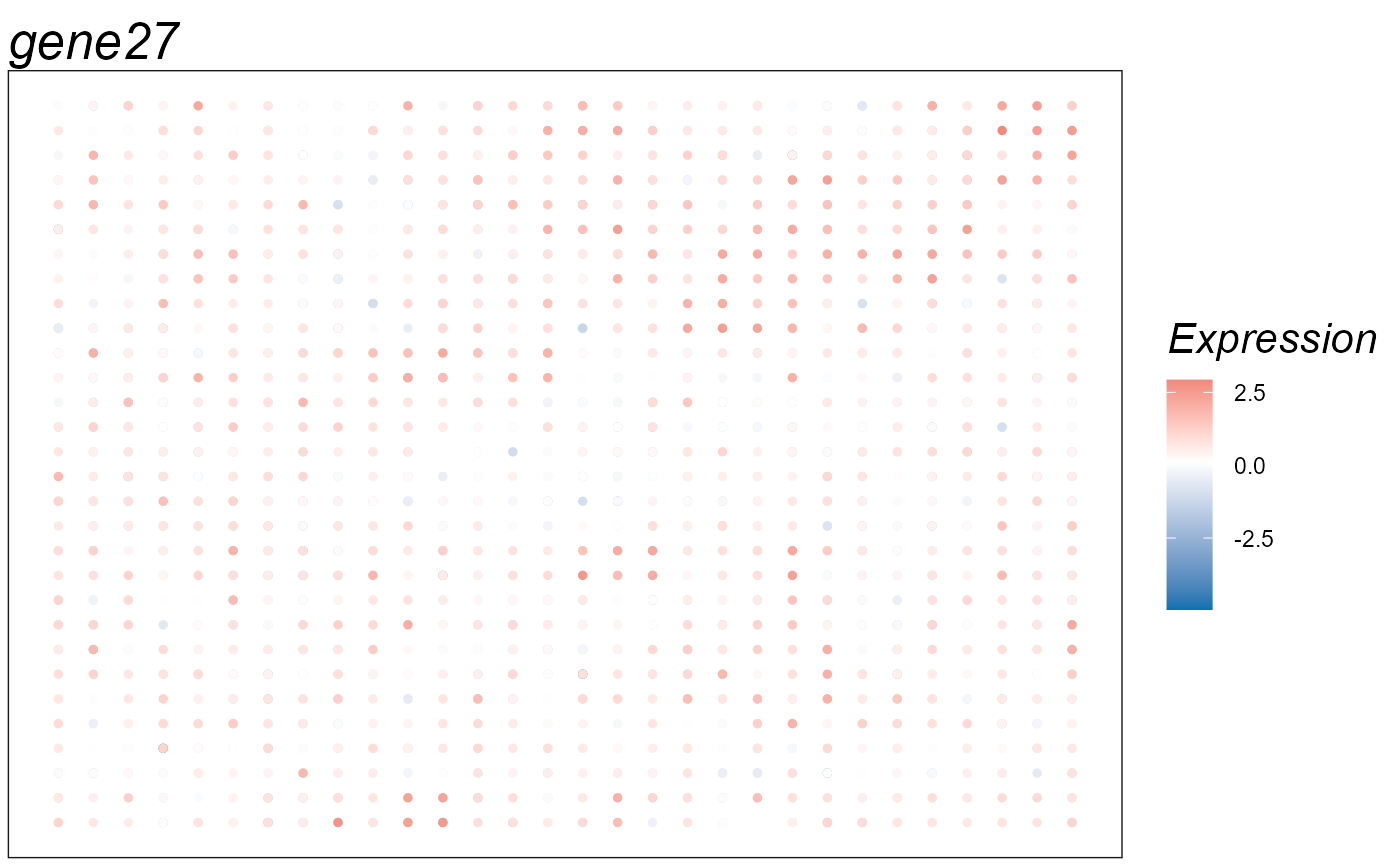
Spatial expression heatmap
featurePlot.RdPlot spatial heatmap for a feature of Seurat object with spatial transcriptomics data.
featurePlot(seu, feature=NULL, cols=NULL, pt_size=1, title_size =16, quant=0.5,
  assay='RNA' , reduction="position")
Arguments
- seu
an object named "Seurat". The object of class "Seurat" must include slot "scale.data".
- feature
an optional string, specify the name of feature to be plotted. If it is null, the first feature will be plotted.
- cols
colors used in the plot
- pt_size
the size of point in the spatial heatmap plot.
- title_size
the title size used for the plot.
- quant
the quantile value to generate the gradient color map.
- assay
the assay selected for plot.
- reduction
the Reduc object for plot.
Details
Nothing
Value
Return a ggplot2 object.
Note
nothing
See also
None
Examples
  library(Seurat)
  data(PRECASTObj)
  PRECASTObj <- SelectModel(PRECASTObj)
  seuInt <- IntegrateSpaData(PRECASTObj, species='unknown')
#> Using only PRECAST results to obtain the batch corrected gene expressions since species is unknown or the genelist in PRECASTObj has less than 5 overlapp with the housekeeping genes of given species.
#> Start integration...
#> 2025-09-29 12:46:04.96664 : ***** Data integration finished!, 0 mins elapsed.
#> Put the data into a new Seurat object...
#> 2025-09-29 12:46:05.024299 : ***** New Seurat object is generated!, 0.001 mins elapsed.
  seuInt <- ScaleData(seuInt)
#> Centering and scaling data matrix
  featurePlot(seuInt, assay='PRE_CAST')