Scatter plot for two-dimensional embeddings
plot_scatter.RdScatter plot for two-dimensional embeddings
plot_scatter(embed_use, meta_data, label_name,
    xy_names=c('tSNE1', 'tSNE2'), no_guides = FALSE,
    cols = NULL,
    point_size = 0.5, point_alpha=1,
    base_size = 12, do_points = TRUE, do_density = FALSE, border_col='gray',
    legend_pos='right', legend_dir='vertical', nrow.legend=NULL)
Arguments
- embed_use
an object named "Seurat", "maxtrix" or "dgCMatrix". The object of class "Seurat" must include slot "scale.data".
- meta_data
an optional positive integer, specify the number of features to be extracted.
- label_name
the size of point in the scatter plot.
- xy_names
the text size in the plot.
- no_guides
whether display the legend.
- cols
colors used in the plot.
- point_size
the point size of scatter plot.
- point_alpha
the transparency of the plot.
- base_size
the base text size.
- do_points
Plot point plot.
- do_density
Plot density plot
- border_col
the border color in the plot.
- legend_pos
the position of legend.
- legend_dir
the direction of legend.
- nrow.legend
the number of rows of legend.
Details
Nothing
Value
Return a ggplot2 object.
Note
nothing
See also
None
Examples
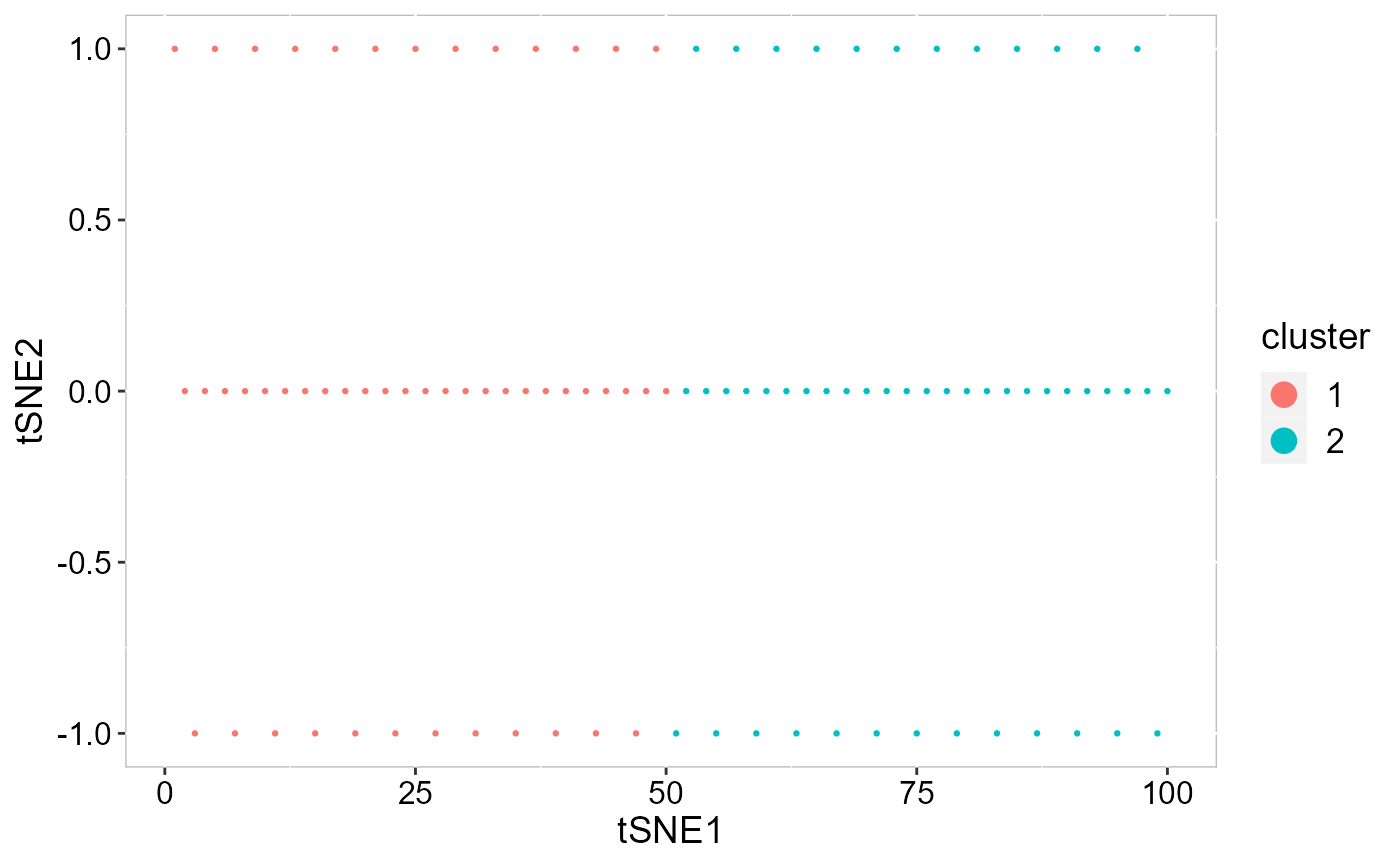
  embed_use <- cbind(1:100, sin((1:100)*pi/2))
  meta_data <- data.frame(cluster=factor(rep(1:2, each=50)))
  plot_scatter(embed_use, meta_data, label_name='cluster')