Volin/boxplot plot
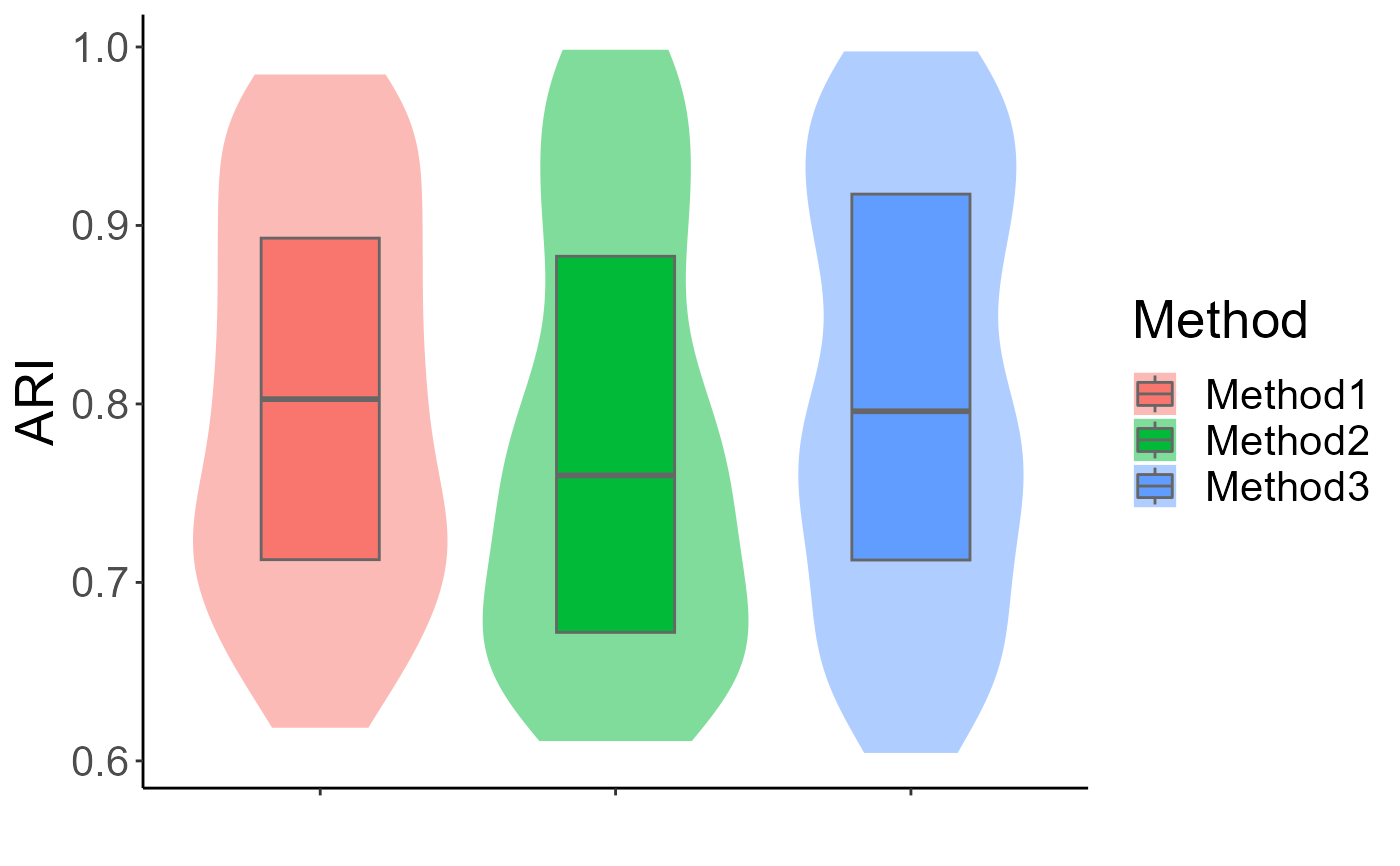
volinPlot_real.RdPlot volin/boxplot.
volinPlot(mat, ylabel='ARI', cols=NULL)Arguments
Details
Nothing
Value
Return a ggplot2 object.
Note
nothing
See also
None
volinPlot_real.RdPlot volin/boxplot.
volinPlot(mat, ylabel='ARI', cols=NULL)Nothing
Return a ggplot2 object.
nothing
None