Spatial heatmap
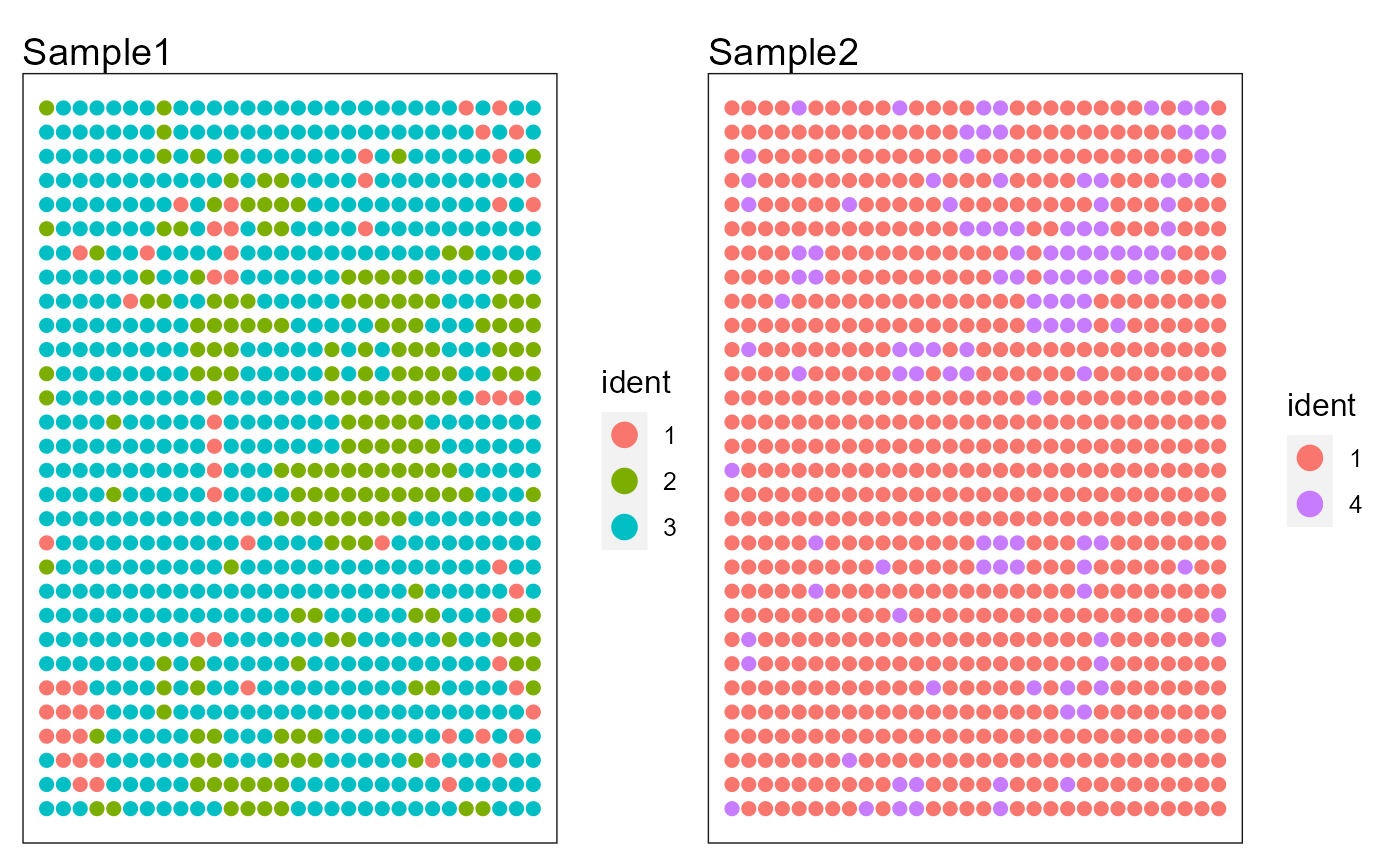
SpaPlot.RdPlot spatial heatmap for a Seurat object with spatial transcriptomics data.
SpaPlot(seuInt, batch=NULL, item=NULL, point_size=2,text_size=12,
                    cols=NULL,font_family='', border_col="gray10",
                    fill_col='white', ncol=2, combine = TRUE,
                    title_name="Sample", ...)
Arguments
- seuInt
an object named "Seurat".
- batch
an optional positive integer or integer vector, specify the batches to be extracted. Users can check the batches' names by
unique(seuInt$batch).- item
an optional string, which column is plotted in the meta data of seuInt. Users can check the meta data by
head(seuInt@meta.data). Ifitemtakes value from ("RGB_UMAP", "RGB_tSNE"), this function will plot the RGB plot.- point_size
the size of point in the scatter plot.
- text_size
the text size in the plot.
- cols
colors used in the plot
- font_family
the font family used for the plot, default as Times New Roman.
- border_col
the border color in the plot.
- fill_col
the color used in backgroup.
- ncol
the number of columns in the layout of plots.
- combine
an optional logical value, whether plot all on a figure. If TRUE, all figures are plotted; otherwise, return a list with each plot as component.
- title_name
an optional string, title name in the plot.
- ...
other arguments passed to
plot_scatter
.
Details
Nothing
Value
Return a ggplot2 object or list of ggplots objects.
Note
nothing
See also
None
Examples
  data(PRECASTObj)
  PRECASTObj <- SelectModel(PRECASTObj)
  seuInt <- IntegrateSpaData(PRECASTObj, species='unknown')
#> Using only PRECAST results to obtain the batch corrected gene expressions since species is unknown or the genelist in PRECASTObj has less than 5 overlapp with the housekeeping genes of given species.
#> Start integration...
#> 2025-09-29 12:46:23.108917 : ***** Data integration finished!, 0 mins elapsed.
#> Put the data into a new Seurat object...
#> 2025-09-29 12:46:23.170894 : ***** New Seurat object is generated!, 0.001 mins elapsed.
  SpaPlot(seuInt)