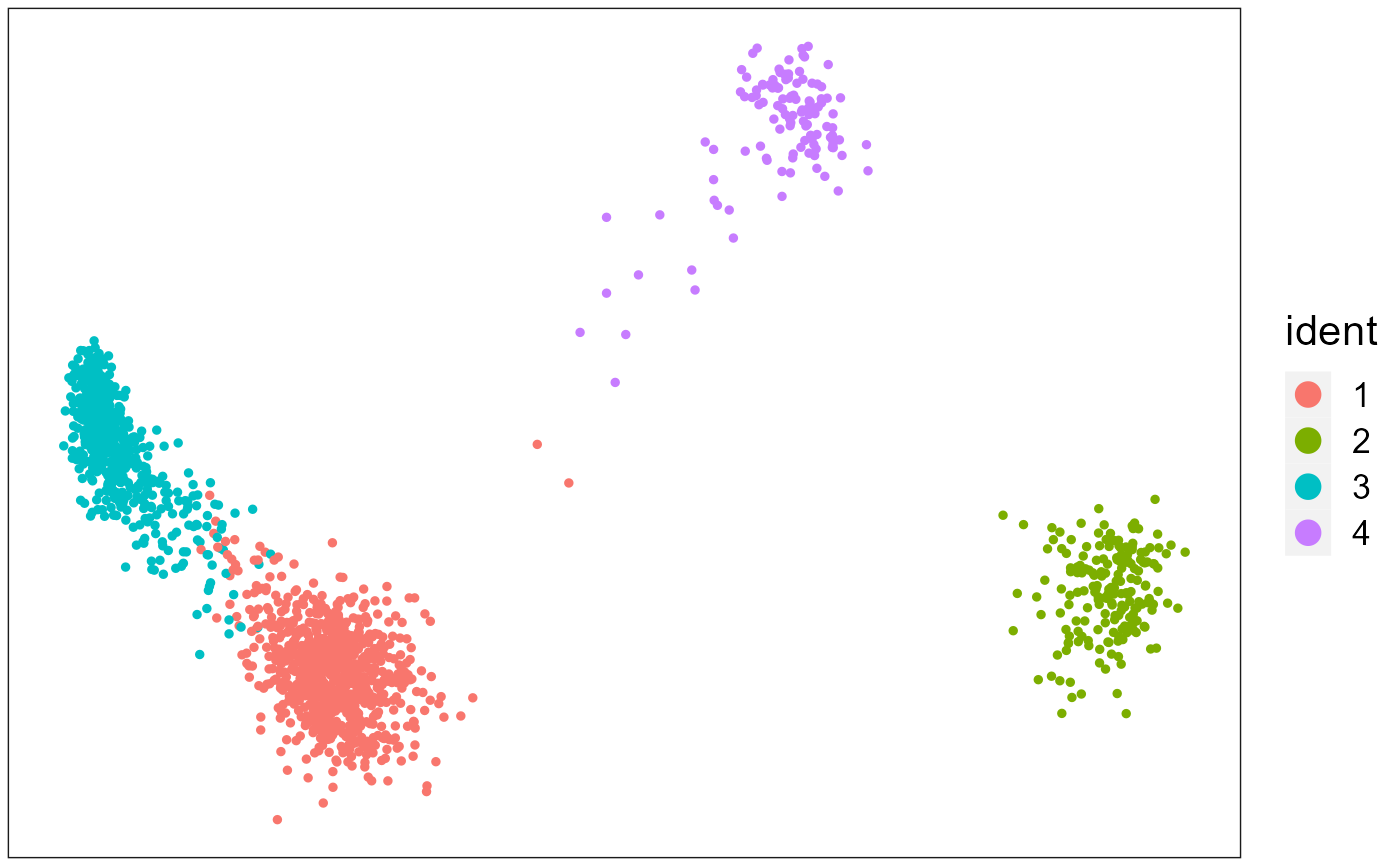
Low-dimensional embeddings' plot
dimPlot.RdLow-dimensional embeddings' plot colored by a specified meta data in the Seurat object.
dimPlot(seuInt, item=NULL, reduction=NULL, point_size=1,text_size=16,
                    cols=NULL,font_family='', border_col="gray10",
                    fill_col="white", ...)
Arguments
- seuInt
an object named "Seurat".
- item
the item used for coloring the plot in the meta data of seuInt object.
- reduction
the reduction used for plot in the seuInt object. If reduction is null, the last added one is used for plotting.
- point_size
the size of point in the scatter plot.
- text_size
the text size in the plot.
- cols
colors used in the plot
- font_family
the font family used for the plot.
- border_col
the border color in the plot.
- fill_col
the color used in backgroup.
- ...
other arguments passed to
plot_scatter
.
Details
Nothing
Value
Return a ggplot2 object.
Note
nothing
See also
None
Examples
  data(PRECASTObj)
  PRECASTObj <- SelectModel(PRECASTObj)
  seuInt <- IntegrateSpaData(PRECASTObj, species='unknown')
#> Using only PRECAST results to obtain the batch corrected gene expressions since species is unknown or the genelist in PRECASTObj has less than 5 overlapp with the housekeeping genes of given species.
#> Start integration...
#> 2025-09-29 12:46:00.08683 : ***** Data integration finished!, 0 mins elapsed.
#> Put the data into a new Seurat object...
#> 2025-09-29 12:46:00.15217 : ***** New Seurat object is generated!, 0.001 mins elapsed.
  dimPlot(seuInt, reduction = 'PRECAST')

  ## or use the Seurat::DimPlot(seuInt, reduction = 'PRECAST')