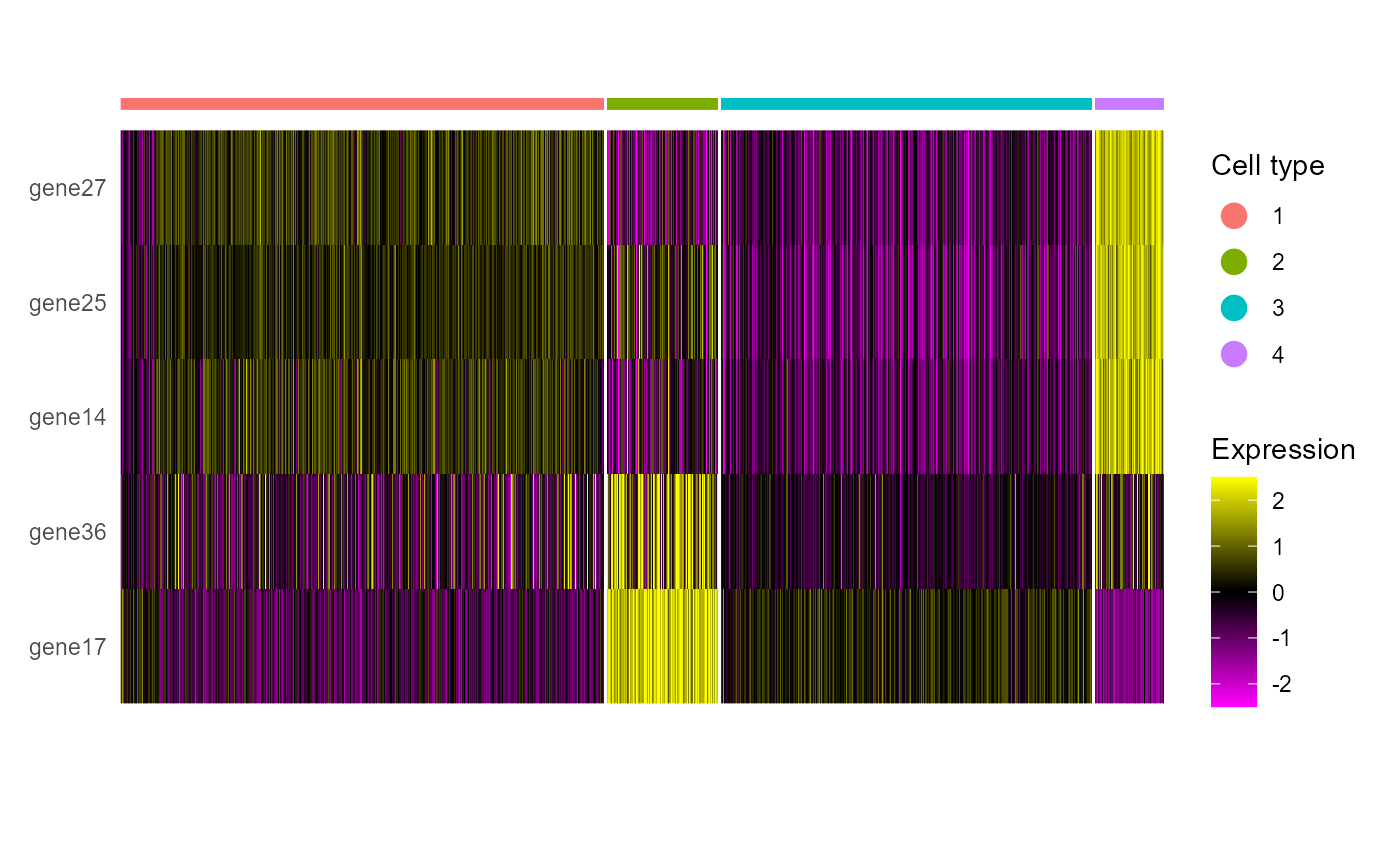
Heatmap for spots-by-feature matrix
doHeatmap.RdPlot heatmap for a Seurat object with expressioin data.
doHeatmap(seu, features=NULL, cell_label='Cell type', grp_label = FALSE,
                      pt_size=4, grp_color=NULL, ...)
Arguments
- seu
an object named "Seurat". The object of class "Seurat" must include slot "scale.data".
- features
an optional string vector, the features to be plotted.
- cell_label
an optional string, the name of legend.
- grp_label
an optional logical value, whether display the group names.
- pt_size
the point size used in the plot
- grp_color
the colors to use for the group color bar.
- ...
Other paramters passed to DoHeatmap.
Details
Nothing
Value
Return a ggplot2 object.
Note
nothing
See also
Examples
  library(Seurat)
  data(PRECASTObj)
  PRECASTObj <- SelectModel(PRECASTObj)
  seuInt <- IntegrateSpaData(PRECASTObj, species='unknown')
#> Using only PRECAST results to obtain the batch corrected gene expressions since species is unknown or the genelist in PRECASTObj has less than 5 overlapp with the housekeeping genes of given species.
#> Start integration...
#> 2025-09-29 12:46:01.069211 : ***** Data integration finished!, 0 mins elapsed.
#> Put the data into a new Seurat object...
#> 2025-09-29 12:46:01.132194 : ***** New Seurat object is generated!, 0.001 mins elapsed.
  seuInt <- ScaleData(seuInt)
#> Centering and scaling data matrix
  doHeatmap(seuInt, features=row.names(seuInt)[1:5])